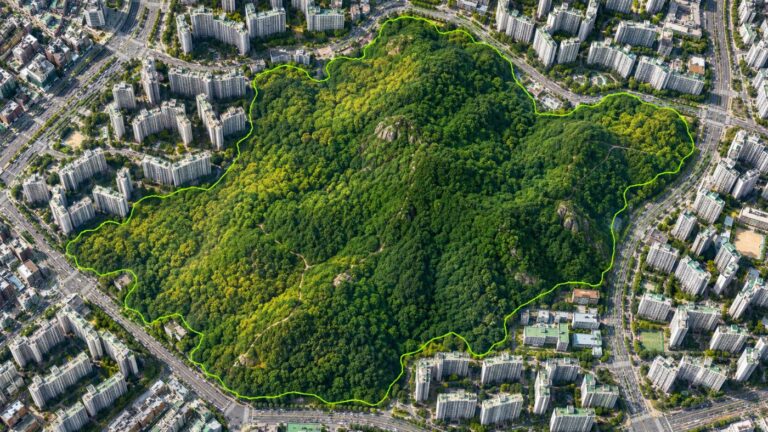
Digital MRV for forest carbon, how satellites measure the carbon in a forest
If you want to see forest carbon widely, often and with one method, satellite-based digital MRV is the most practical place to start.
The traditional way to learn how much carbon a forest holds is a tree inventory. Surveyors walk into sample plots, measure diameter and height, and feed the values into statistical equations for the whole forest. It is accurate, but slow and expensive, so most forests see a few plots every few years.
Satellites cover the other side. They see the same forest from edge to edge every few days, with the same method each time. They cannot measure individual trees, but they do not miss how the forest as a whole is changing.
Below we explain what digital MRV is, the steps that turn satellite data into carbon numbers, and how far those numbers can be trusted.
Category: Forest carbon
MRV means measurement, reporting and verification; digital MRV automates the front end
For a carbon project to be recognised, its reductions or removals must be measured, reported in a set format and verified by a third party.
Digital MRV automates measurement and reporting with satellite and sensor data and keeps the evidence verification needs: which scenes were used, how cloudy they were and how uncertain the result is. It does not replace verification itself.
Satellite data becomes a carbon number in four steps
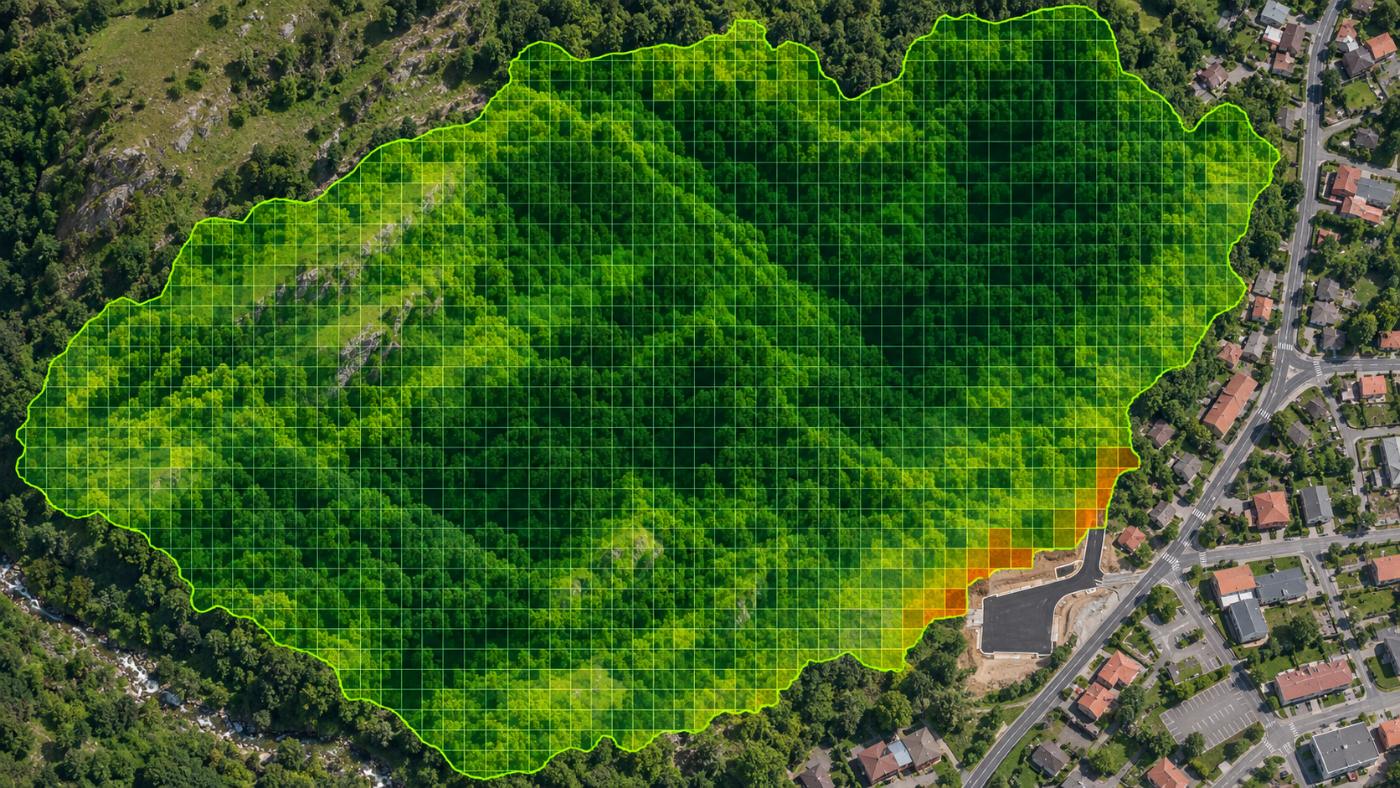
First, keep only good pixels. Every Sentinel-2 pixel carries a scene classification (SCL) such as vegetation, bare soil, cloud, shadow or water. Only vegetation and bare-soil pixels stay in the calculation.
Second, compute vegetation indices. Leaves reflect near-infrared strongly and absorb red light. NDVI captures that contrast; EVI reduces saturation over dense forest and NDMI reads moisture.
How satellite data becomes a carbon number
Keep SCL 4 and 5 pixels; drop cloud, shadow and water.
NDVI, EVI and NDMI read greenness and moisture.
A national inventory baseline scaled by a satellite multiplier.
Carbon pools, CO₂e and annual uptake via light-use efficiency.
A simplified view of the CANOPY calculation order.
Third, estimate biomass. Indices alone do not tell you how much wood there is, so a baseline is taken from Korea Forest Service stand volume and NIFoS coefficients (wood density, biomass expansion factor) and scaled to the present by satellite. Radar and NASA GEDI lidar add structural information.
Fourth, convert to carbon and uptake. About half of biomass is carbon; adding roots, deadwood and litter and multiplying by 44/12 gives tonnes of CO₂ equivalent. Annual uptake is estimated from how much sunlight the leaves absorb over a year. The framework follows the IPCC 2006 Guidelines, AFOLU volume.
Every number needs its evidence and limits attached
Satellite carbon figures are estimates. They should travel with the scene used, the cloud cover and how far the result could move if inputs shift (uncertainty). CANOPY attaches all of this to the measurement history and the report.
These numbers are also not credit quantities. To become credits they must pass tests such as additionality, leakage and permanence and be validated by a third party.
Digital MRV is strongest at deciding where to look first
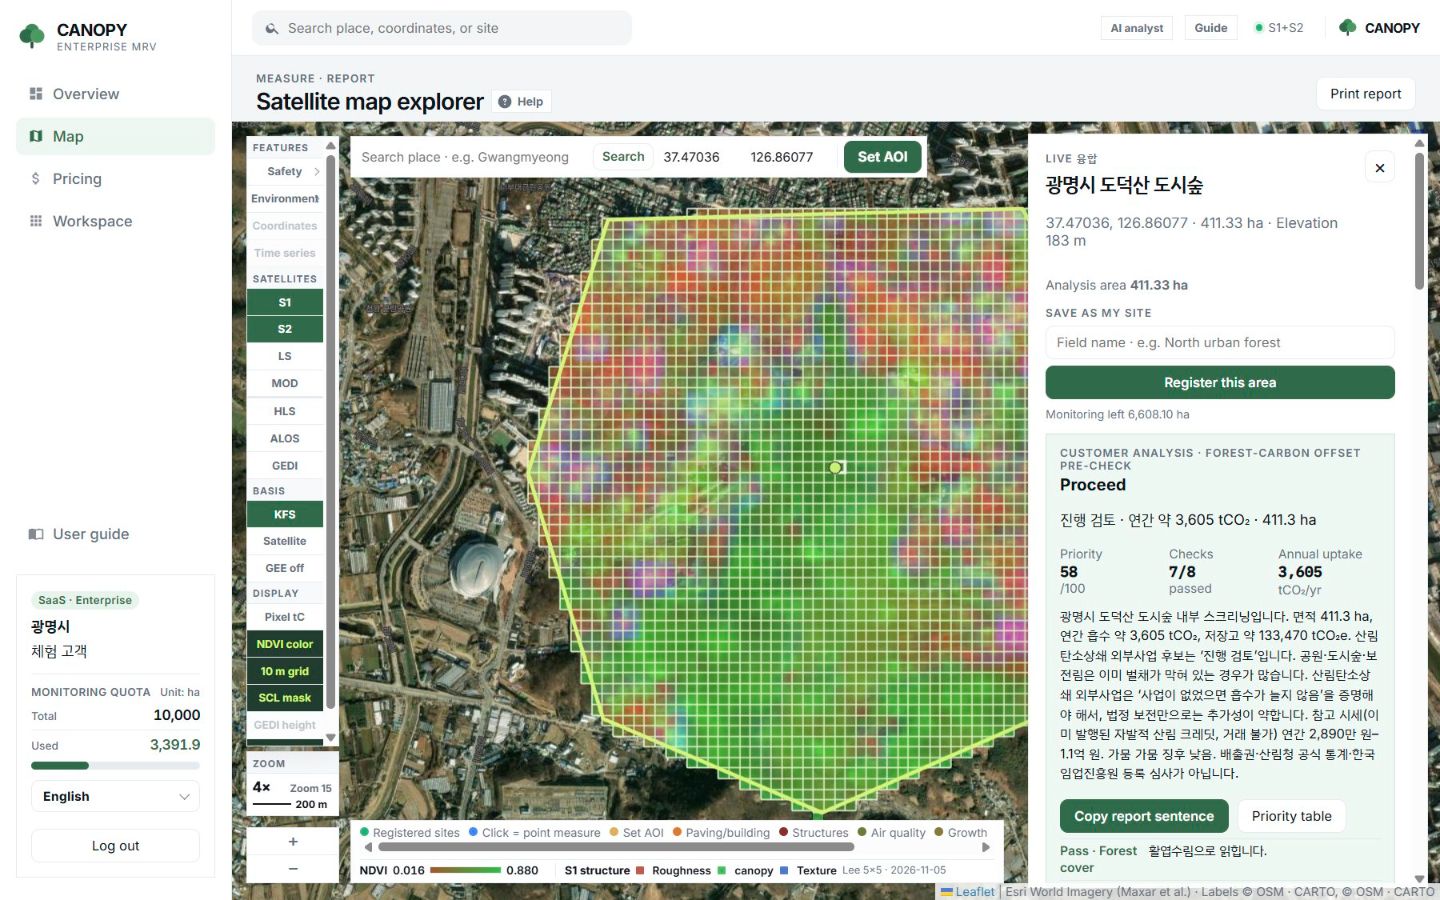
If you manage many forests, you can screen them from space before sending surveyors everywhere. Start with the ones that have high uptake density, clear boundaries and few drought or development signals.
CANOPY turns this into a pre-check (proceed, review, weak candidate) and a 0–100 priority, then carries it into report sentences and Verra and Gold Standard document drafts. The full method is on the forest carbon measurement page.
Frequently asked questions
How accurate is satellite-measured carbon?
It depends on forest type, cloud and the reference statistics. That is why an uncertainty band is shown and field plots are assumed for confirmation.
Can digital MRV earn credits directly?
No. Registration and issuance follow a standard’s methodology and third-party validation. Digital MRV lightens the measurement and reporting load in that process.
Which satellite data is free?
Sentinel-1 and 2, Landsat, MODIS and GEDI, all mentioned here, are public and free.
Want to see your forests from above first?
Register your forest polygons and we will screen carbon stock, annual uptake and candidate quality from public satellite data.
Book a demo →Edited and answered by the MomentCube CANOPY team / james@momentcube.com · +82-32-212-1011