Counting forest carbon, 10 m at a time.
CANOPY adds radar and GEDI lidar to Sentinel-2 vegetation indices, anchors them to Korea Forest Service stand volume statistics and computes aboveground biomass, carbon stock and annual uptake.
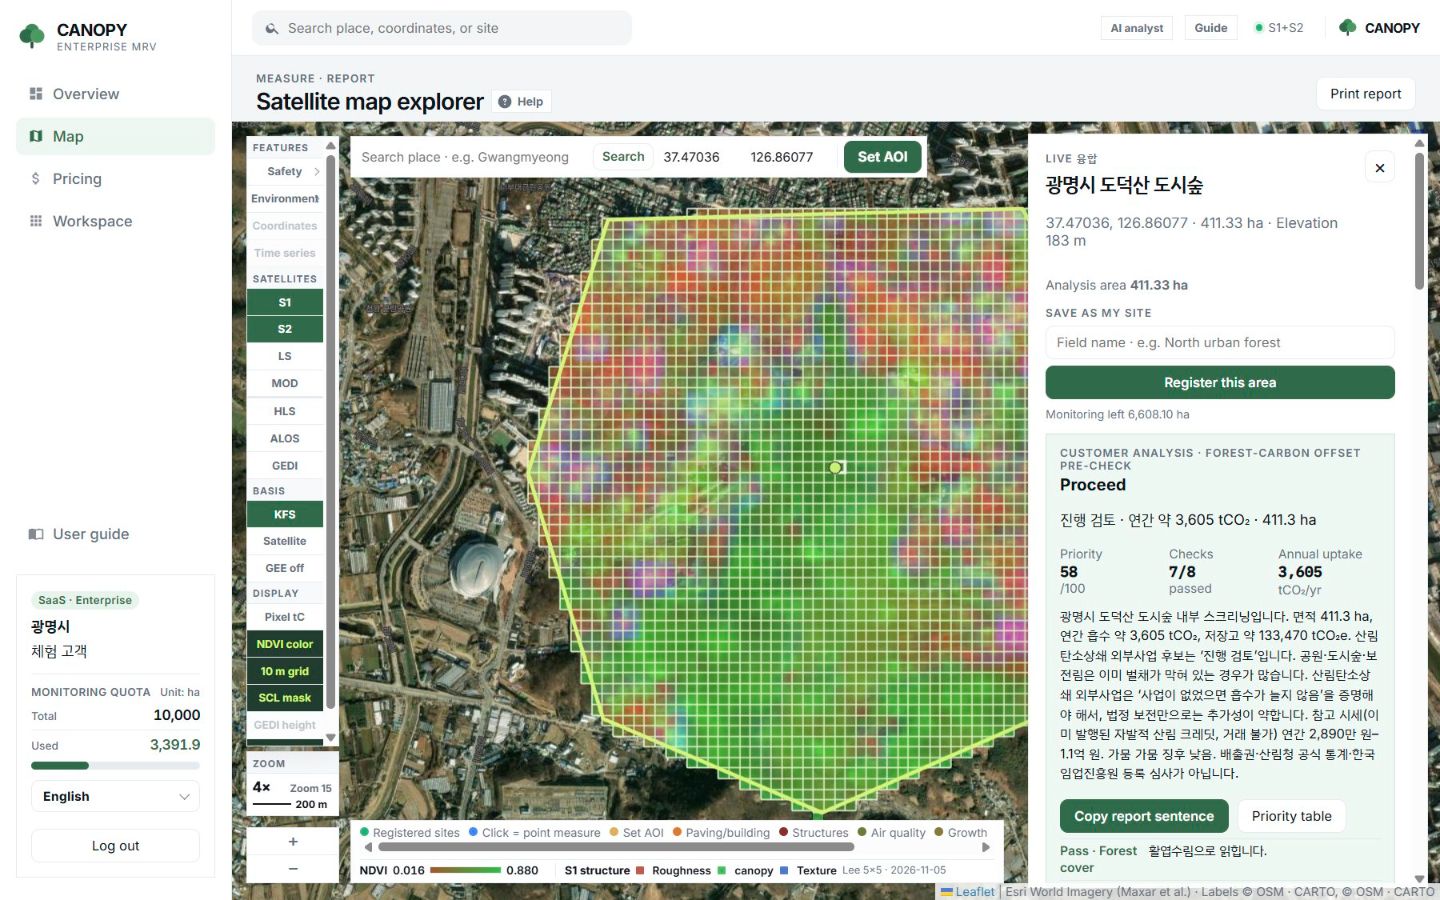
Measure
Pick a boundary and the grid appears.
Draw a forest or click a registered site and run Environment → Carbon. The 10 m grid is coloured by vegetation index and the forest-wide means appear on the right.
- Only SCL 4 (vegetation) and 5 (bare) pixels are averaged
- Switch on Pixel tC to recolour cells by carbon
- Zoom in far enough and numbers appear on the cells
- Each run records scene ID, cloud cover and uncertainty
Sensor fusion
Greenness alone does not tell you how much wood is there.
NDVI shows how green a forest is but struggles to separate tree height from stem density. So three kinds of satellite data are aligned on the same 10 m cells.
Sentinel-2 optical
Greenness and cover per cell. The backbone of the grid and the time series, weighted at about 50%.
Sentinel-1 · ALOS-2 radar
Sees through cloud whether forest is standing; the multiplier drops when the signal collapses after felling. About 20%.
NASA GEDI lidar
Canopy height (RH100) and biomass density on a 1 km grid. About 30%.
Formulas
From biomass to CO₂e
| Step | Method |
|---|---|
| Baseline biomass | KFS 2020 stand volume (V) × wood density (WD) × biomass expansion factor (BEF) |
| Present-state scaling | A satellite multiplier, clamped to roughly 0.18–1.22, fits the baseline to today’s forest |
| Carbon | C = AGB × 0.5 × (1 + root ratio R + deadwood 0.11) + litter 2.1 tC/ha |
| CO₂ conversion | tCO₂e = C × 44/12 |
| Annual uptake | fAPAR = 1.24 × NDVI − 0.168, NPP = ε × fAPAR × PAR; mature forest keeps only part of NPP as NEP |
| Basis choice | Two paths: KFS statistics, or a satellite path with a typical temperate value (about 142 t/ha) |
Sources: Korea Forest Service 2020 Forest Basic Statistics, NIFoS coefficients, IPCC 2006/2019 AFOLU, Monteith (1972). Not a replacement for official statistics.
Pre-check
After a run, three questions are answered.
These are the questions an officer asks before a consultation: is this forest a candidate, what goes in the report, and which forest comes first.
Forest-carbon offset pre-check
Area, forest cover, NDVI, boundary, scene quality, drought, an additionality hint and annual uptake become proceed, review or weak candidate.
Report sentence
A paragraph for an internal approval or council report, with a copy button and an indicative voluntary-market price band.
Priority
A 0–100 score from uptake density, area, integrity, NDVI, boundary type and drought. An order to look at, not a revenue ranking.
FAQ
Frequently asked questions
Why not just use NDVI?
NDVI saturates around 0.7, so dense forests look alike. EVI, SAVI and NDMI are read alongside it, and radar and GEDI height add structure.
Is the per-cell carbon a lidar measurement?
No. Per-cell values are KFS stand volume scaled by that cell’s satellite multiplier. They are not laser shots per cell or a 95% confidence interval.
Is annual uptake a credit quantity?
No. Additionality, leakage, buffers and registry issuance are not computed. It is an estimate of the net carbon the forest added in a year.
Related pages
Work with us
Start with a satellite screening of your forests.
Send us your forest boundaries. We screen carbon stock, annual uptake and candidate quality from public satellite data first, then walk through the results with you. No field equipment is needed.