Measure, decide and document forest carbon on one platform.
CANOPY connects measurement, reporting and verification prep on a single map. Carbon is the core, and the same satellite data powers safety, environment and agriculture screening.
Modules
Six capabilities
Everything runs in the browser. For registered forests, the server pre-fetches scenes and grids so they open instantly next time.
Forest carbon measurement
Biomass, carbon stock and annual uptake per 10 m cell.
Dynamic baseline & additionality
Similar forest, compared on the same dates.
10-year series & feasibility
Pixel trends for the last ten years and a ten-year outlook.
Verra · Gold Standard draft PDF
Outline drafts and a quantitative appendix.
Safety screening
Displacement, sinkholes and power-plant discharge.
Environment & agriculture
Air quality, paving, drought, crop growth and fields.
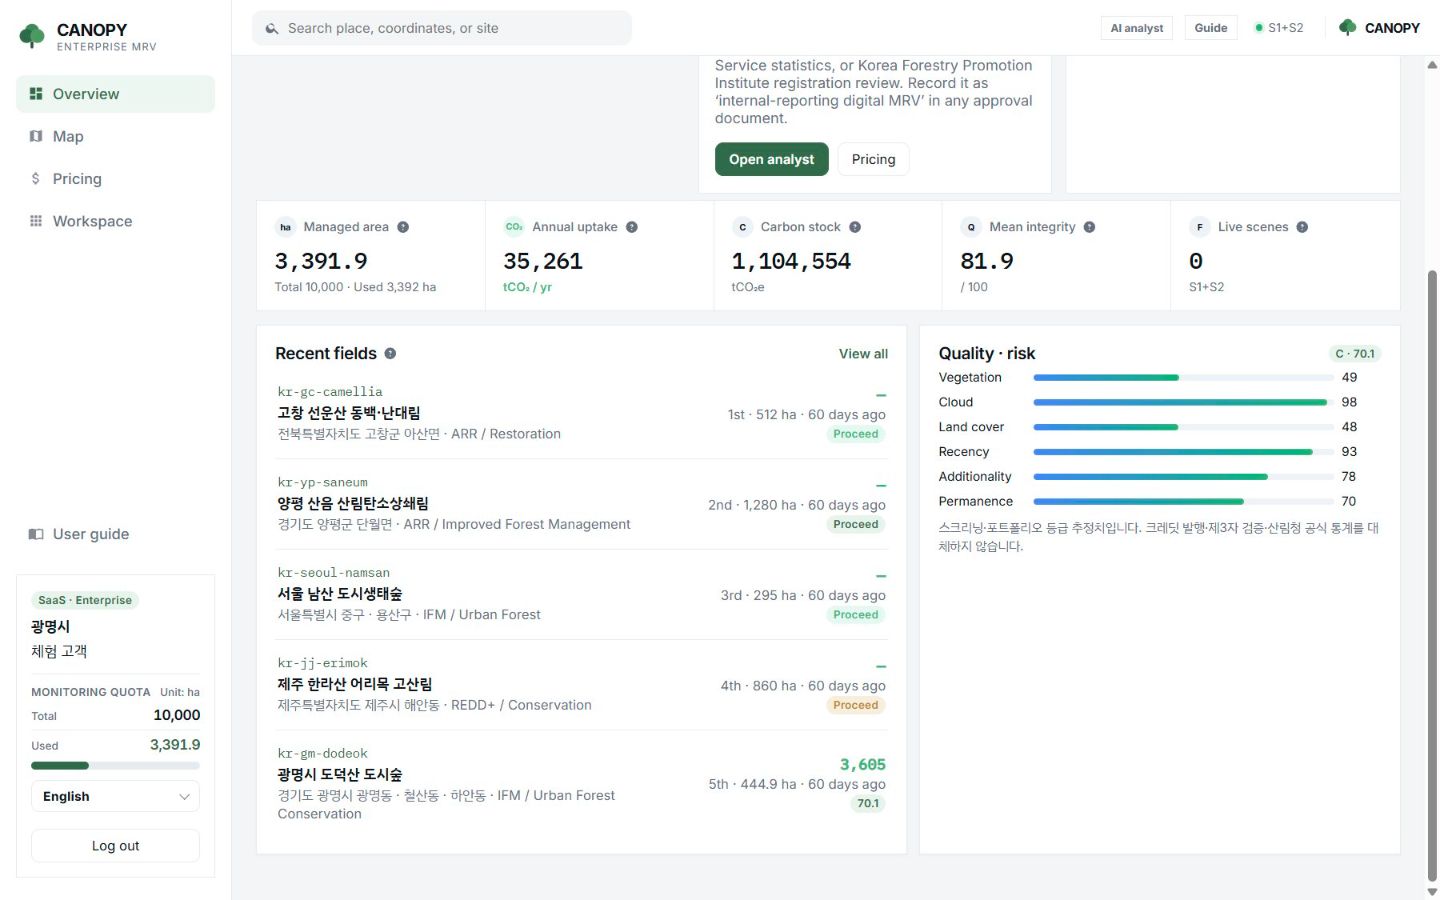
Workspace
Separate per organisation, with a history for every forest.
After login the organisation name shows at the lower left and you work only with its forests. Every run stores scene ID, cloud cover and uncertainty in the measurement history.
- Managed area, annual uptake, carbon stock and mean integrity on one screen
- Verdict and priority table by site
- Measurement history and standard PDF download
- Interface in 17 languages
Specification
Data and outputs
| Item | Detail |
|---|---|
| Satellites | Sentinel-2 L2A, Sentinel-1, ALOS-2 PALSAR, NASA GEDI, Landsat 8/9, HLS, MODIS |
| Grid | 10 m × 10 m from Sentinel-2 (one pixel = 0.01 ha) |
| Reference statistics | Korea Forest Service 2020 stand volume; NIFoS wood density, expansion factors and root ratios; EGIS stand-type map |
| Weather | ERA5 reanalysis (radiation, precipitation, soil moisture) |
| Outputs | Carbon stock (tCO₂e), annual uptake (tCO₂/yr), pre-check verdict, priority, report sentence, standard PDF draft |
| Delivery | Web SaaS, annual subscription with a hectare quota |
FAQ
Frequently asked questions
Do I need to install anything?
No. Log in from a web browser. No field equipment is needed either.
How many forests can I register?
As many as fit within your tier’s monitoring quota in hectares. Extra hectares can be added per year.
Is the AI report sentence written by a generative model?
No. Measured values fill a fixed sentence template, so the same numbers always produce the same text.
Related pages
Work with us
Start with a satellite screening of your forests.
Send us your forest boundaries. We screen carbon stock, annual uptake and candidate quality from public satellite data first, then walk through the results with you. No field equipment is needed.