Measure forest carbon from orbit first.
CANOPY screens the carbon stock and annual uptake of your registered forests on a 10 m grid, ranks which ones are worth pursuing, and drafts Verra and Gold Standard outline documents. A subscription digital MRV service. No field equipment to install.
The problem
Measuring forest carbon is still slow and expensive.
A forest carbon project takes months of plot surveys, project documents and third-party validation. Before all that, it is hard to tell which forests are even worth the effort.
Sparse field surveys
Tree inventories are accurate, but they visit a few plots every few years. What happened across the rest of the forest in between stays blank.
Numbers are not a decision
A protected forest may show strong uptake and still fail as an offset candidate because of additionality.
Months of paperwork
Verra and Gold Standard project descriptions (PD, PDD) take months to fill, including fields a satellite could fill.
Platform
From measurement to document drafts, on one screen.
Register a forest and CANOPY measures it from space, pre-checks whether it is a candidate, compares it with similar forest, looks back ten years and turns it into a document draft.
Forest carbon measurement
Vegetation indices and biomass per 10 m cell, turned into carbon stock and annual uptake.
Dynamic baseline & additionality
Finds similar forest outside the site, compares it on the same dates and flags additionality risk.
10-year series & feasibility
Looks back over ten growing seasons pixel by pixel and projects ten years ahead on three tracks.
Verra · Gold Standard draft PDF
An outline draft with the satellite-visible fields filled, plus a quantitative appendix.
Safety screening
Bridge and building displacement candidates, sinkhole risk and power-plant discharge on the same map.
Environment & agriculture
Air quality, newly paved ground, drought, crop growth and field-boundary candidates.
Live product
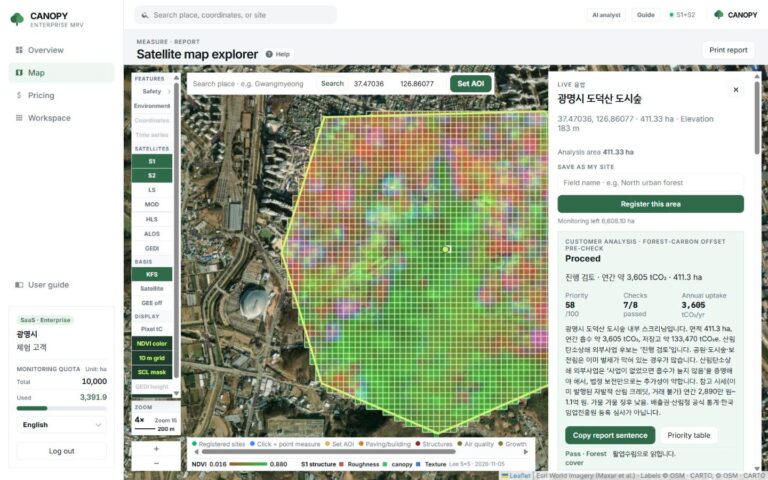
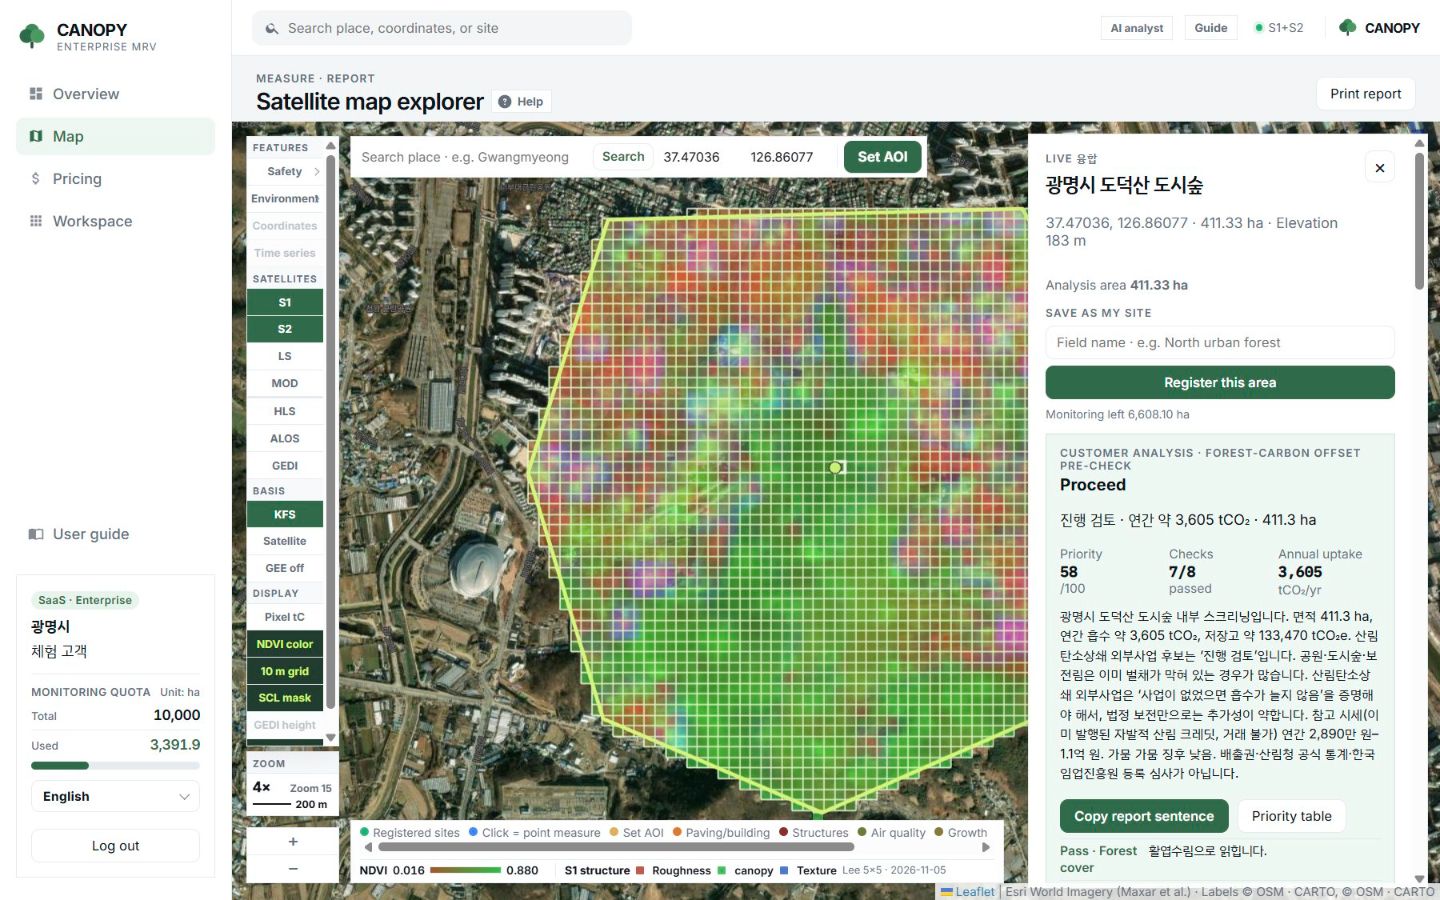
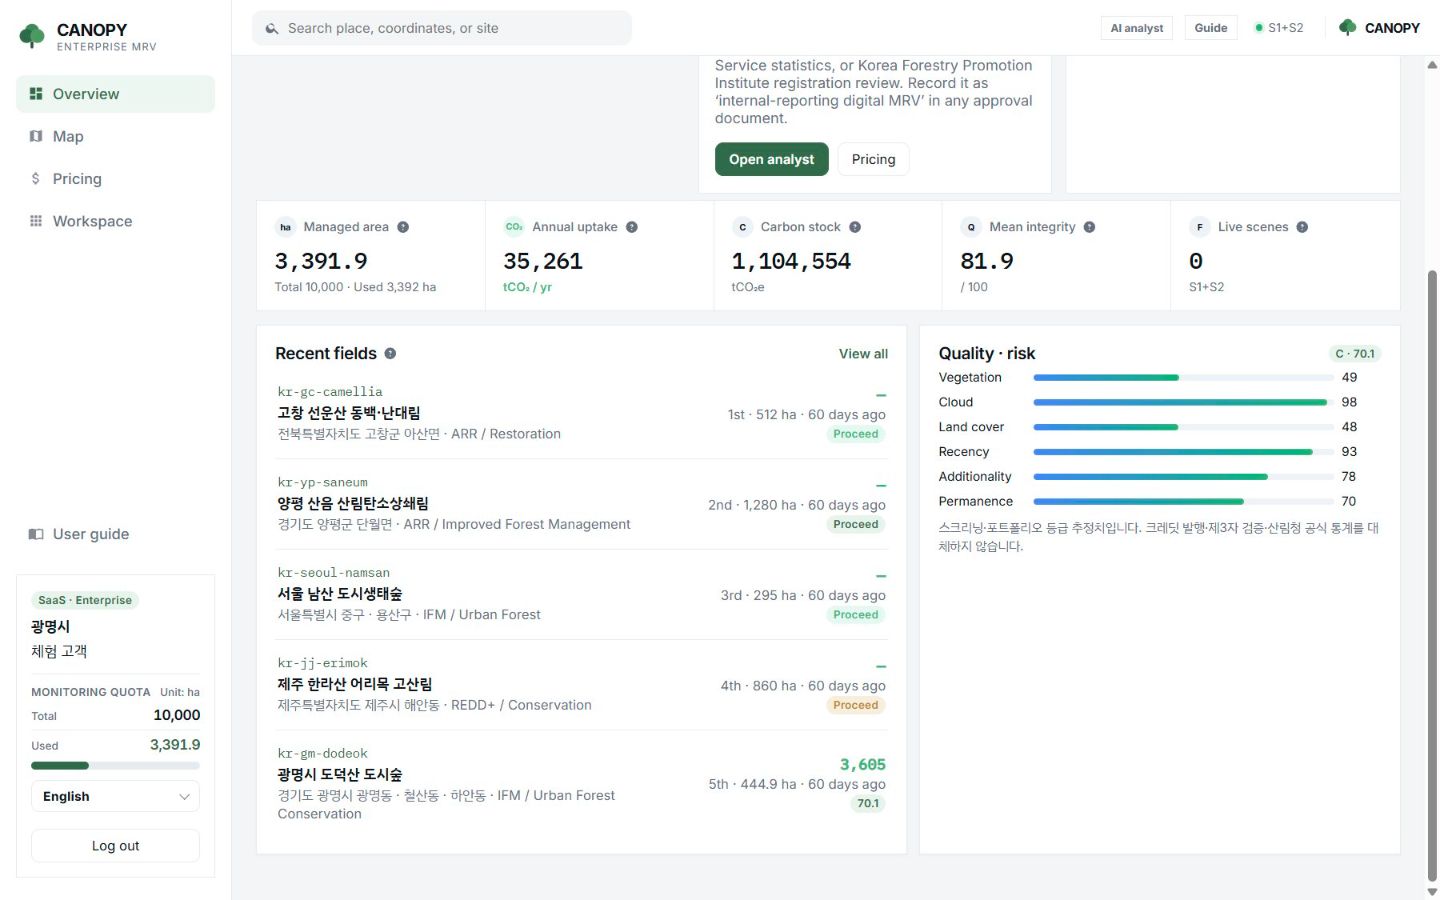
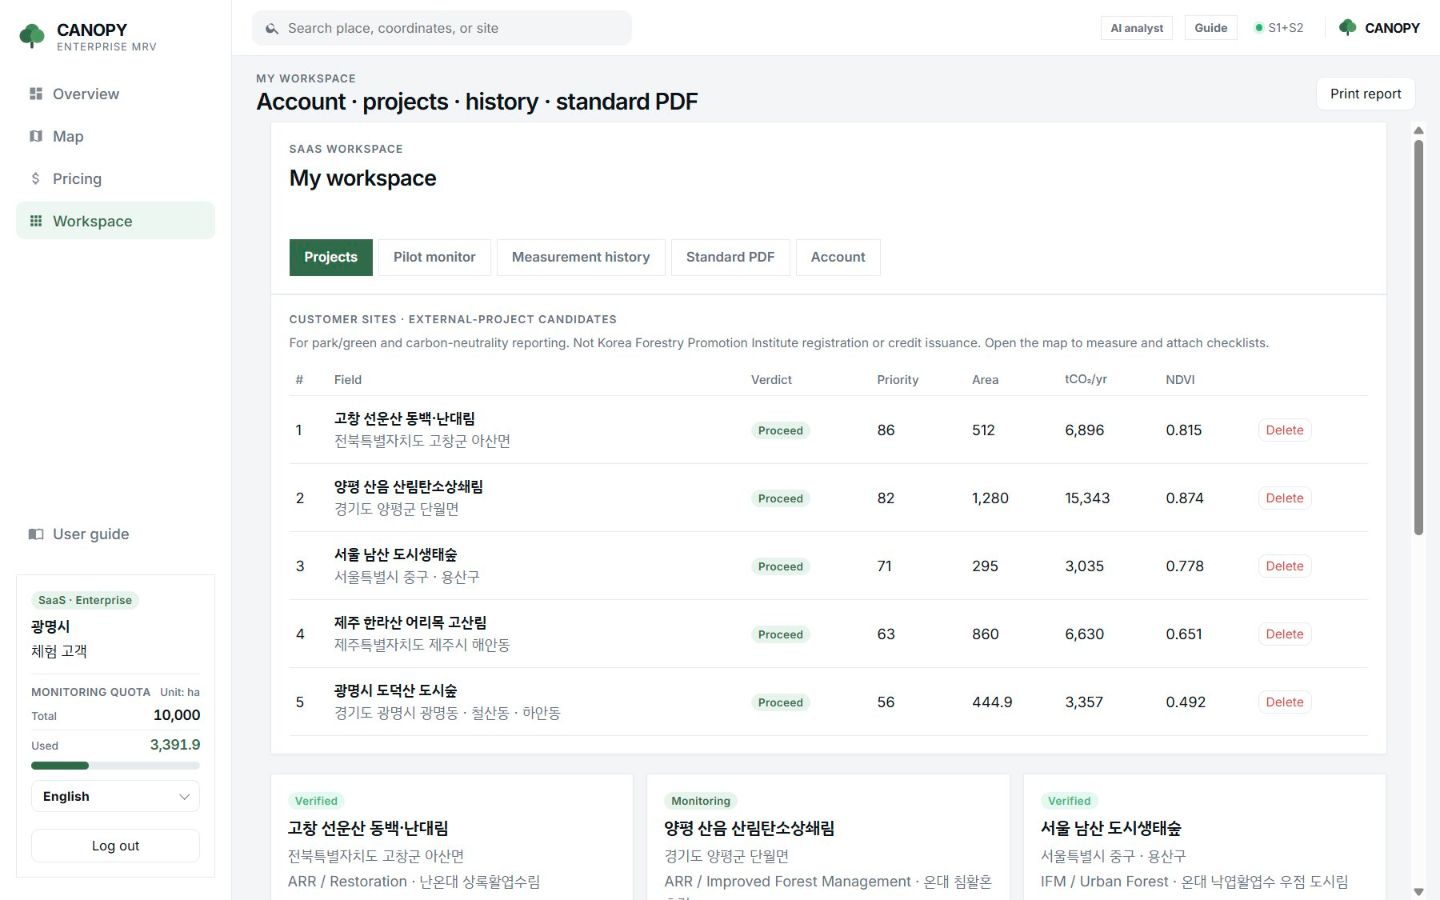
This is CANOPY running today.
Screens from a demo workspace with five example forests. Figures are satellite screening results, not issued credits.
How it works
From a forest boundary to a document draft, in four steps.
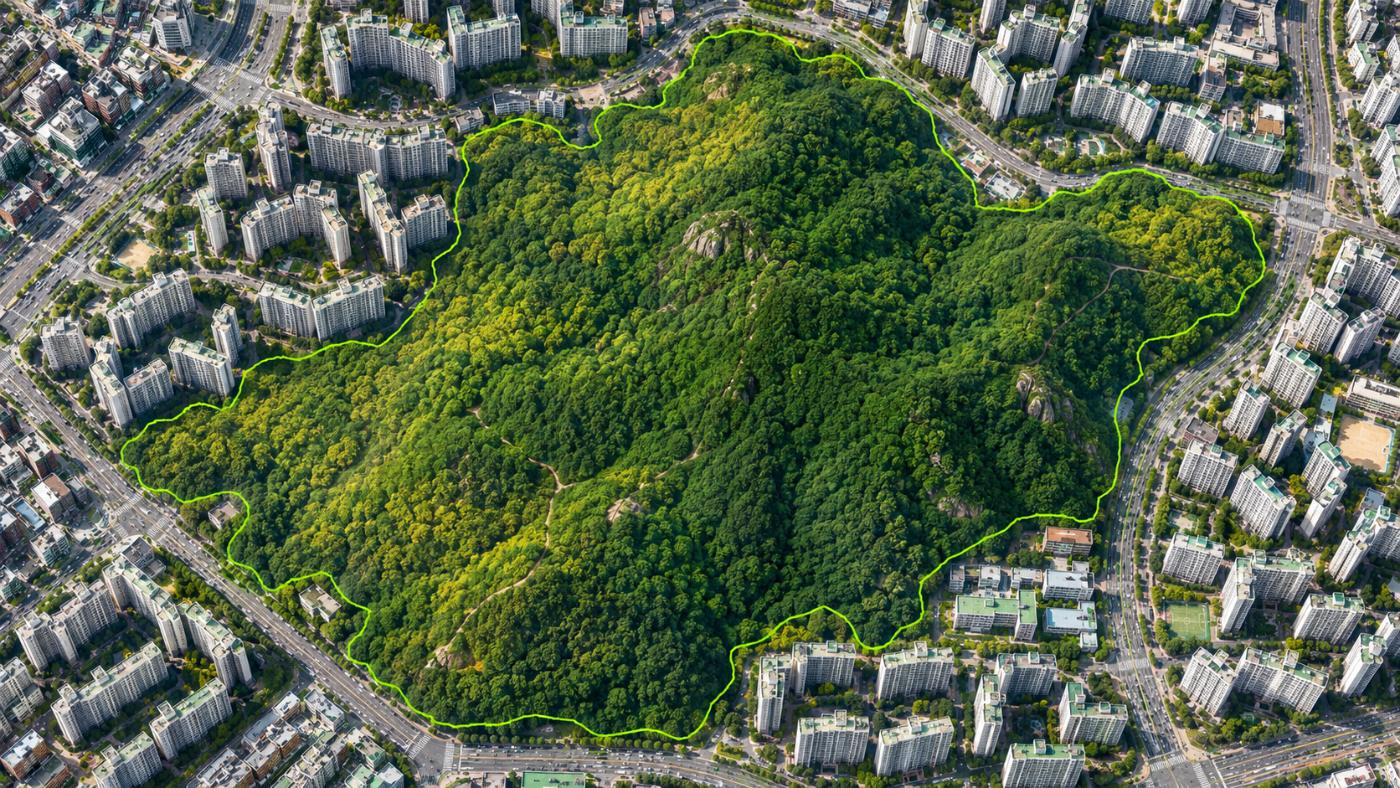
Register
Draw or upload the boundaries of the forests you manage. Each organisation has its own workspace.
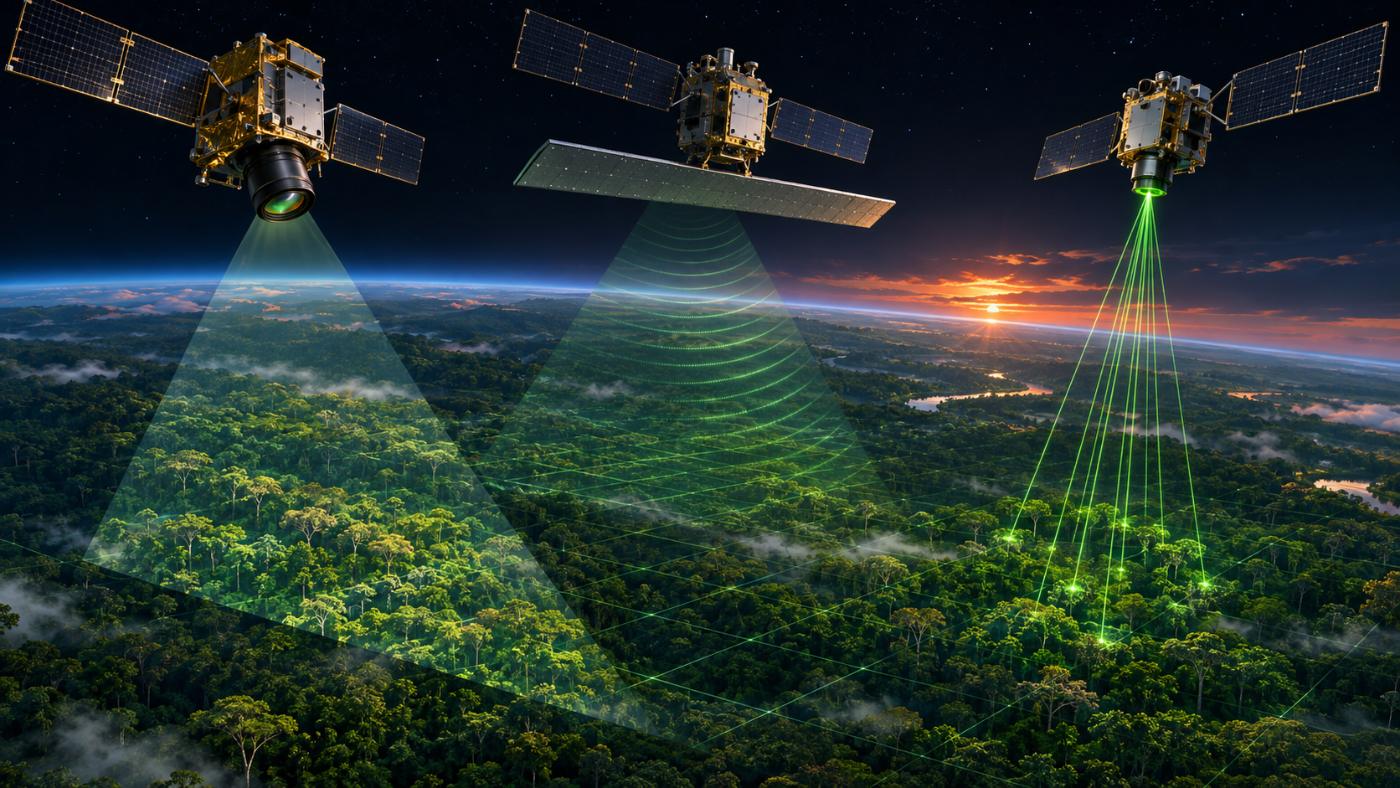
Measure
Sentinel-2 optics form the backbone; radar and GEDI are added to compute biomass and carbon per 10 m cell.
Pre-check & rank
Area, cover, scene quality, drought and an additionality hint become a proceed, review or weak verdict and a ranking.
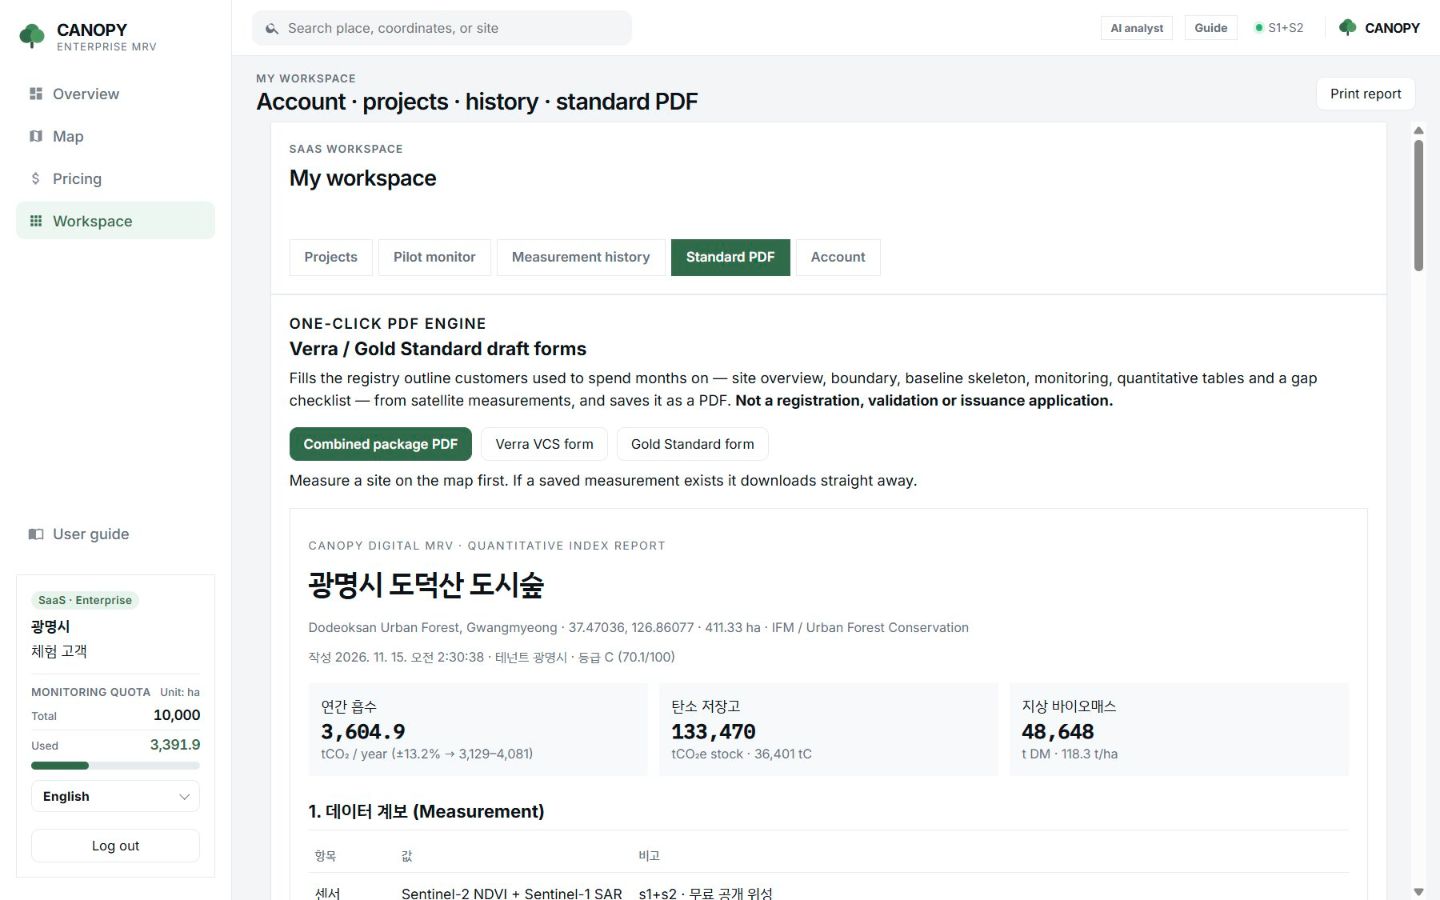
Report & draft
Copy the internal report sentence and download the Verra and Gold Standard outline PDF.
Built on free public satellites and public statistics
Method
We show exactly where the numbers come from.
CANOPY computes carbon from published statistics and formulas. Scene ID, cloud cover, uncertainty and the integrity grade travel with every result.
| Item | Method |
|---|---|
| Pixel quality | Only Sentinel-2 SCL 4 (vegetation) and 5 (bare) pixels are averaged. Cloud, shadow, water and snow drop out. |
| Vegetation indices | NDVI, EVI, SAVI, NDMI, GNDVI and fractional vegetation cover (FVC) |
| Aboveground biomass | Korea Forest Service 2020 stand volume × wood density × biomass expansion factor, scaled to the present by a satellite multiplier |
| Carbon · CO₂e | C = AGB × 0.5 × (1 + root ratio + 0.11) + 2.1 tC/ha, tCO₂e = C × 44/12 |
| Annual uptake | Monteith light-use efficiency for NPP, converted to net ecosystem production (NEP) |
| Record | Scene ID · cloud cover · uncertainty (±%) · integrity grade (out of 100) |
A screening only. It does not replace credit issuance, official Korea Forest Service statistics, registry review, or Verra and Gold Standard validation.
Who it is for
Built for the people who manage and report on forests.
Municipal climate reporting, corporate nature-based climate action, forest-carbon project origination and urban forest management, all on one platform.
- Local governments: every forest in the district, same method every year
- Corporate ESG: check the forest before you buy into it
- Project developers: candidate screening and document drafts
- Urban forests & parks: edge development and drought watch
Why CANOPY
Not just a map. A basis for decisions.
Field inventories give precise reference values. CANOPY fills the wide area and the last ten years in between, and tells you which forest to look at first.
| Field inventory | Satellite index maps | CANOPY | |
|---|---|---|---|
| Coverage | A few plots | Whole forest | Whole forest (10 m grid) |
| Updates | Every few years | Per scene | Per scene, auto-fetched for registered sites |
| Carbon conversion | Field measurements | Usually none | tCO₂e and annual uptake from KFS statistics |
| Candidate decision | Expert review | None | Proceed, review or weak; additionality watch |
| Documents | Written by hand | None | Verra and Gold Standard outline PDF |
General characteristics of each approach. They vary by provider. Full comparison
Demo portfolio
Five Korean forests show how it works.
The demo workspace holds five example forests of different types in Korea, about 3,392 ha in total.
Gochang Seonunsan camellia and warm-temperate forest
512 ha · restoration (ARR) · demo priority #1
Yangpyeong Saneum forest-carbon offset forest
1,280 ha · improved forest management (IFM)
Seoul Namsan urban ecological forest
295 ha · urban forest
Jeju Hallasan Eorimok montane forest
860 ha · conservation (REDD+)
Gwangmyeong Dodeoksan urban forest
about 445 ha · urban forest conservation, additionality watch
About 3,392 ha
Total area of the five example forests
Demo data created by the CANOPY team. These are not customer contracts or credit projects.
The company
A team that runs AI in the field.
CANOPY is built by MomentCube, an industrial AI company that combines its experience in on-site video and sensor AI monitoring with satellite data.
3 government R&D projects
Switchgear predictive maintenance, situation-aware safety AI, and Safety4Cut with NVIDIA.
3 registered patents
Industrial AI safety management, autonomous equipment management and automatic report generation.
Public-sector operation
AI fire and safety monitoring deployed at Incheon Environmental Corporation.
Certified venture
Innovation-growth venture company with a dedicated R&D department.
FAQ
Frequently asked questions
What is CANOPY?
CANOPY is a satellite digital MRV (measurement, reporting and verification) service for forest carbon, built by MomentCube. It screens carbon stock and annual uptake of registered forests from space, pre-checks whether they are project candidates and drafts Verra and Gold Standard outline documents.
Does CANOPY issue carbon credits?
No. The tCO₂e in CANOPY is a satellite screening value. It does not replace credit issuance, official Korea Forest Service statistics, registry review or third-party validation (VVB). It helps decide which forest to look at first.
Which satellites and data does it use?
Sentinel-2 optics (10 m) form the backbone, with Sentinel-1 and ALOS-2 radar and NASA GEDI lidar added, and Landsat 8/9, HLS and MODIS filling gaps. Biomass baselines come from Korea Forest Service stand volume statistics and NIFoS coefficients.
Does it replace field surveys?
No. Satellites see the whole forest often, but they do not measure tree height or diameter directly. CANOPY picks the forests and areas where a field survey is worth doing.
What happens with clouds?
Cloud, shadow, water and snow pixels are excluded from the carbon figures (SCL 4 and 5 only). If too few pixels survive, the next scene is used. Radar checks that the forest is still standing regardless of cloud.
How is pricing set?
It is an annual subscription. Tiers depend on the monitored area in hectares, the number of safety, air-quality and growth screenings, and seats. Tell us your area and scope and we will send a quote.
Insights
CANOPY blog
Why urban forests often fail as offset projects, additionality and dynamic baselines
Why an urban forest with strong uptake can still fail as a carbon offset candidate, and how a satellite dynamic baseline compares…
Digital MRV for forest carbon, how satellites measure the carbon in a forest
What digital MRV for forest carbon is, how satellite data becomes biomass, carbon stock and annual uptake, and where the limits are.
Why NDVI alone is not enough, estimating forest biomass with optical, radar and GEDI
Why NDVI saturates over dense forest, and how Sentinel-1 and ALOS-2 radar and NASA GEDI lidar are combined with optical data to…
Work with us
Start with a satellite screening of your forests.
Send us your forest boundaries. We screen carbon stock, annual uptake and candidate quality from public satellite data first, then walk through the results with you. No field equipment is needed.