Why NDVI alone is not enough, estimating forest biomass with optical, radar and GEDI
Rely on NDVI alone to estimate forest biomass from space and the differences vanish as forests get denser. That is why optical, radar and lidar data belong together.
NDVI is the most widely used vegetation index. It uses the way leaves reflect near-infrared and absorb red light to express how green a forest is in a single number.
The problem is that NDVI stops rising once a forest is dense enough. It saturates around 0.7, so a 30-year-old forest and a 60-year-old forest can look alike, even though one holds nearly twice the wood.
Here we explain the limits of NDVI and how different kinds of satellites can be aligned on the same cells and used together.
Category: MRV methods
Optical satellites see the surface of the forest
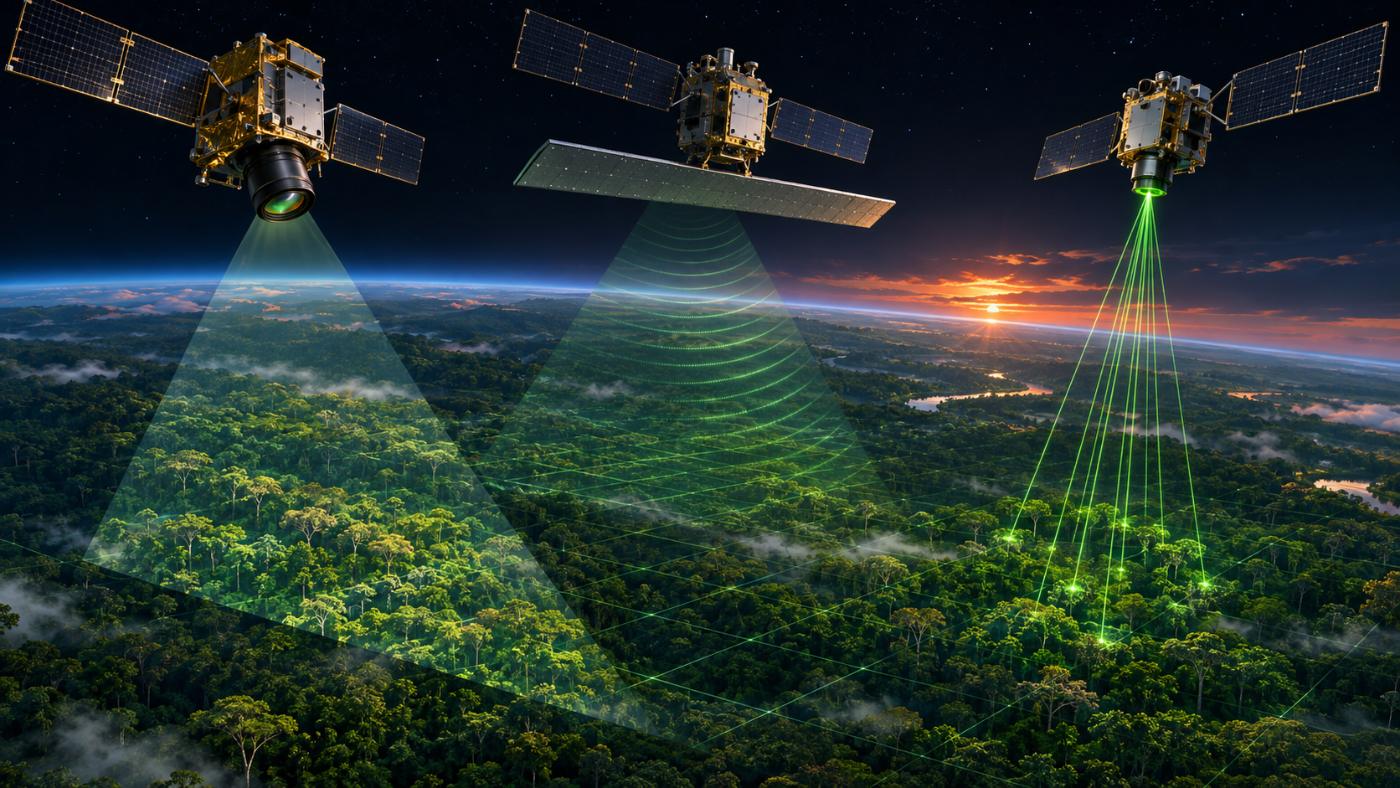
Optical satellites such as Sentinel-2 see light reflected from the canopy. At 10 m every few days, they capture greenness, cover and seasonal change well, which makes them a good backbone for a grid and a time series.
But light does not reach far below the canopy, so stem size and density are hard to read from the surface, and cloud hides everything.
Radar senses structure through cloud
Radar satellites such as Sentinel-1 (C-band) and ALOS-2 (L-band) send their own signal and record the echo. They work through cloud and at night, and the strength of the echo from branches and stems shows whether the forest is standing. After felling, the signal collapses.
The longer L-band responds a little more to stems than C-band. Radar still does not measure tree height or diameter directly.
What three kinds of satellite see
Canopy greenness and cover, 10 m, every few days.
Whether forest stands, structure signal, through cloud.
Canopy height and biomass density, 1 km grid.
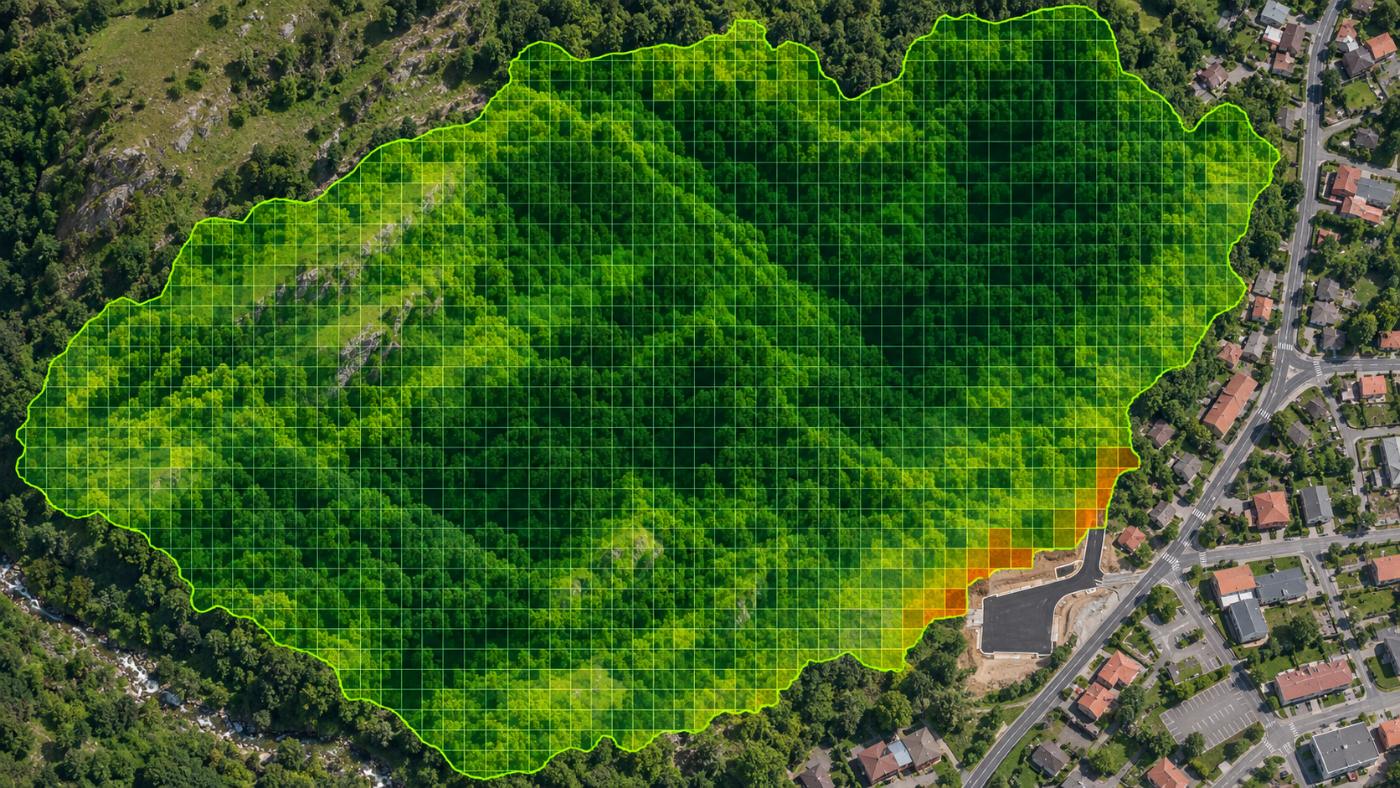
Aligned on the same 10 m cells and weighted.
Default CANOPY weights: optical about 50%, radar about 20%, GEDI about 30%.
Lidar measures height
NASA GEDI is a laser instrument on the International Space Station. The time difference between returns from the canopy top and the ground gives forest height, and biomass density products are built on it.
Height is the closest proxy for biomass, but GEDI does not image the whole Earth without gaps, so its 1 km gridded product is used as a prior. In urban forests, buildings inside the 1 km cell pull the value below the real stand, so only the height information is used there.
Fusion works as “baseline × satellite multiplier”
CANOPY takes a forest’s baseline biomass from Korea Forest Service stand volume statistics and fits it to the present with multipliers from the three satellite types. The multiplier is clamped to roughly 0.18–1.22 to avoid extreme values.
This keeps the national statistical baseline while reflecting current change such as felling, drought and growth. The formulas are published on the forest carbon measurement page.
Frequently asked questions
Does more satellite data always mean more accuracy?
Not always. Aligning data of different resolutions and dates can add error, so each source is weighted and uncertainty is shown.
Does GEDI cover Korea?
Yes. GEDI observes roughly between 51.6° north and south, which includes the Korean peninsula.
Wouldn’t drone lidar be more accurate?
For small areas, drone lidar is far more precise. Satellites are strong at seeing large forests often with one method. Using both works best.
Want to see your forests from above first?
Register your forest polygons and we will screen carbon stock, annual uptake and candidate quality from public satellite data.
Book a demo →Edited and answered by the MomentCube CANOPY team / james@momentcube.com · +82-32-212-1011