Protect the city’s forests from the edge in.
Urban forests surrounded by apartments and roads shrink from the edge first. CANOPY watches carbon, edge development and drought on the same map.
Watch
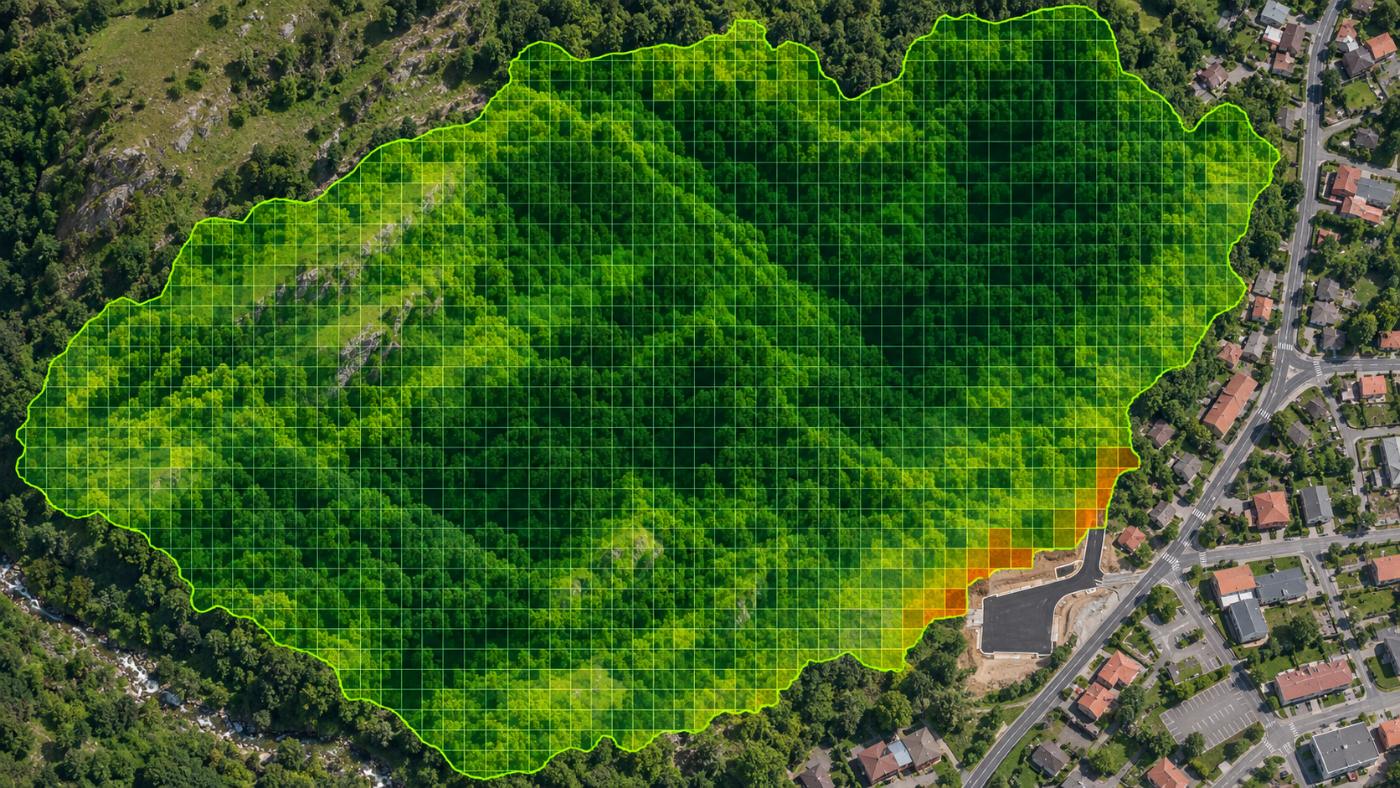
Green is forest; orange at the edge is a paving candidate.
Cells that look newly paved or built between two dates are overlaid in orange on the carbon grid.
- Carbon stock per 10 m cell
- Paving and building candidates (two-date comparison)
- Drought watch (SPI, soil moisture, NDMI)
- S1 structure map separates sports fields and buildings
Good to know
Protected forests rarely qualify as offset projects.
Urban forests and nature parks are often already protected from felling. Even if satellites show strong uptake, it is hard to show the uptake would not have happened without a project. CANOPY flags these forests with an additionality watch and points them toward management and reporting use rather than external offsets.
Gwangmyeong Dodeoksan urban forest in the demo portfolio is one example.
FAQ
Frequently asked questions
Can it support park and green-space reporting?
Yes. It produces numbers and evidence for park, green-space and carbon-neutral reporting. It does not replace official statistics.
Can I see individual trees?
No. The unit is a 10 m cell. Individual tree registers are kept through field surveys.
What about building shadows?
Shadow pixels (SCL 2 and 3) are excluded from the carbon mean, so mixed edges are computed mostly from forest pixels.
Related pages
Work with us
Start with a satellite screening of your forests.
Send us your forest boundaries. We screen carbon stock, annual uptake and candidate quality from public satellite data first, then walk through the results with you. No field equipment is needed.