To the forest edge and beyond.
Protecting forest carbon is tied to what happens on the land around it. CANOPY screens air quality, newly paved ground, drought and crop growth on the same map.
Environment
Change around the forest
Paving and building candidates
Two low-cloud Sentinel-2 dates are compared; neighbouring cells where NDBI rose and NDVI fell are painted orange. Patches over about 15 ha are treated as land-cover change and dropped.
Drought screening
Three-month SPI, soil-moisture percentile and growing-season NDVI and NDMI are read together. A drought watch appears only when they dry out together.
Air quality
PM10, PM2.5, NO₂, O₃, SO₂ and CO from the Copernicus CAMS global model. One cell is about 40 km, so it is not a station reading.
Agriculture
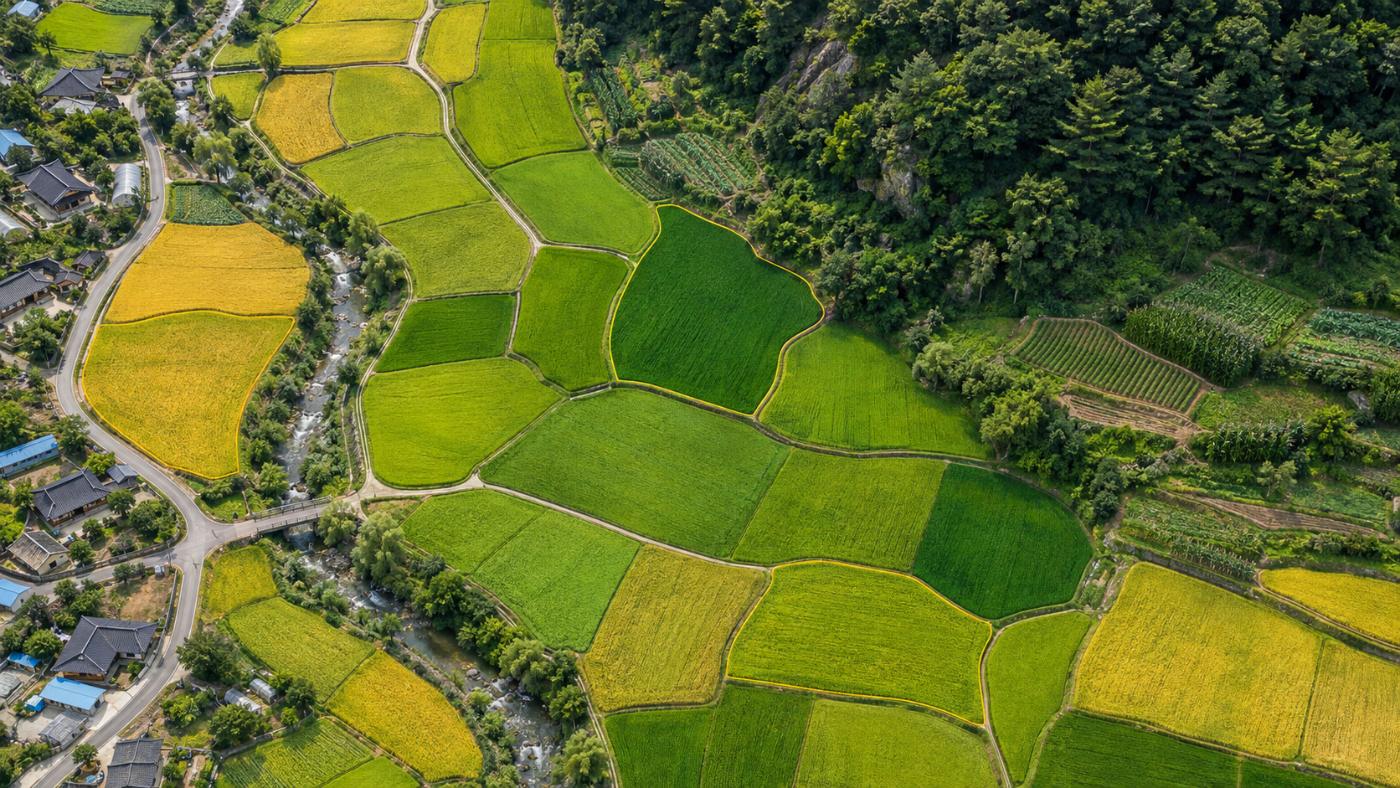
Different greens and yellows per plot mean different growth stages.
Pick a point and choose paddy, upland or orchard: a 10 m NDVI grid is laid within about 400 m and monthly NDVI, NDMI and growing degree days are read.
- Green-up, vegetative, peak and senescence candidates
- Moisture-stress candidate cells
- SAM2 segments field-boundary candidates (gold polygons)
- Not a yield, harvest date or crop assessment
FAQ
Frequently asked questions
Are paving candidates illegal buildings?
No. They are ground that looks newly paved or built, regardless of permits.
Does it replace drought alerts?
No. It is not an official drought stage or emergency alert. It is a screening that reads rain, soil and leaves together.
Can I use field boundaries for registration?
No. They are not cadastral maps or farmland registers and should not be used for registration, conversion or subsidy review.
Related pages
Work with us
Start with a satellite screening of your forests.
Send us your forest boundaries. We screen carbon stock, annual uptake and candidate quality from public satellite data first, then walk through the results with you. No field equipment is needed.