Look back ten years, sketch the next ten.
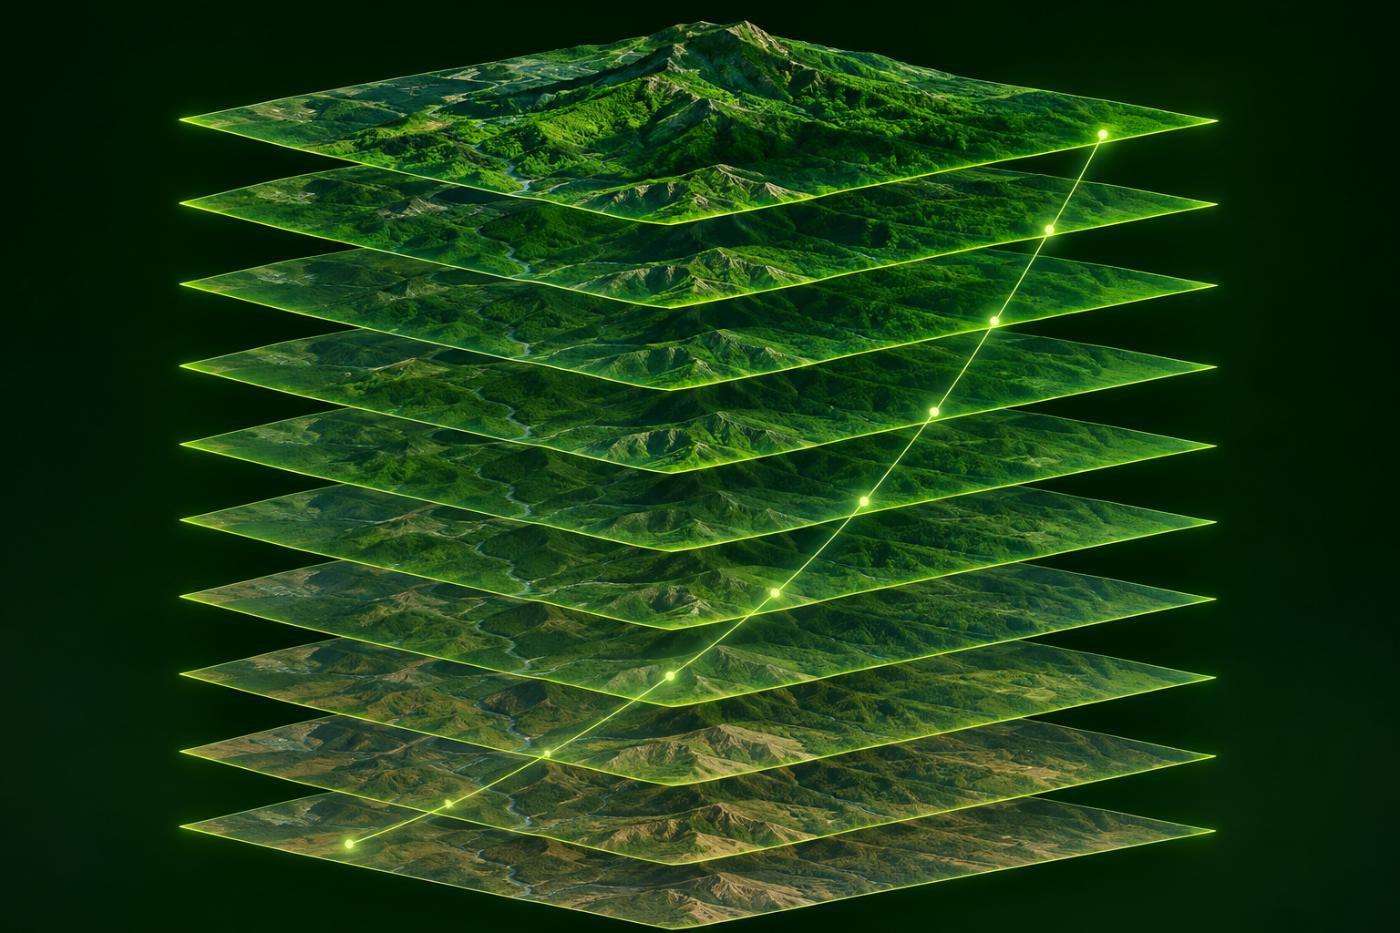
For each registered forest, CANOPY gathers the last ten growing seasons pixel by pixel, reads the trend in greenness and uptake, and uses that slope to project feasibility ten years ahead on three tracks.
How it is built
The clearest scene of each year.
One low-cloud Sentinel-2 scene is chosen from May to October of each year, averaging SCL 4 and 5 pixels only. Landsat 8/9 fills years without Sentinel-2.
- Runs only when you press the button, separate from measurement
- Least-squares NDVI slope per pixel
- Share of rising, falling and steady pixels
- Large sites use a grid coarser than 10 m
Outlook
Three feasibility tracks
The past annual tCO₂ slope is damped and extended ten years ahead, then multiplied by an indicative price band to give a screening value.
Conservative
The slope is cut hard, assuming continued drought or disturbance.
Baseline
The past trend continues with gentle damping.
Optimistic
The past trend is mostly kept.
Not a growth model, a discount rate or a Verra crediting period. One scene a year cannot capture winter, felling and drought in full.
FAQ
Frequently asked questions
Why only one scene a year?
To compare the forest under the same growing-season conditions every year. It is not daily observation, so short disturbances can be missed.
Is this a GEDI height trend?
No. The pixel slope uses Sentinel-2 NDVI, or Landsat where Sentinel-2 is missing.
Is the money figure a revenue forecast?
No. It multiplies by a voluntary-market forest-credit price band as a screening. It does not guarantee project revenue.
Related pages
Work with us
Start with a satellite screening of your forests.
Send us your forest boundaries. We screen carbon stock, annual uptake and candidate quality from public satellite data first, then walk through the results with you. No field equipment is needed.